
Quick Answer: What Should You Check When Ecommerce Growth Stalls?
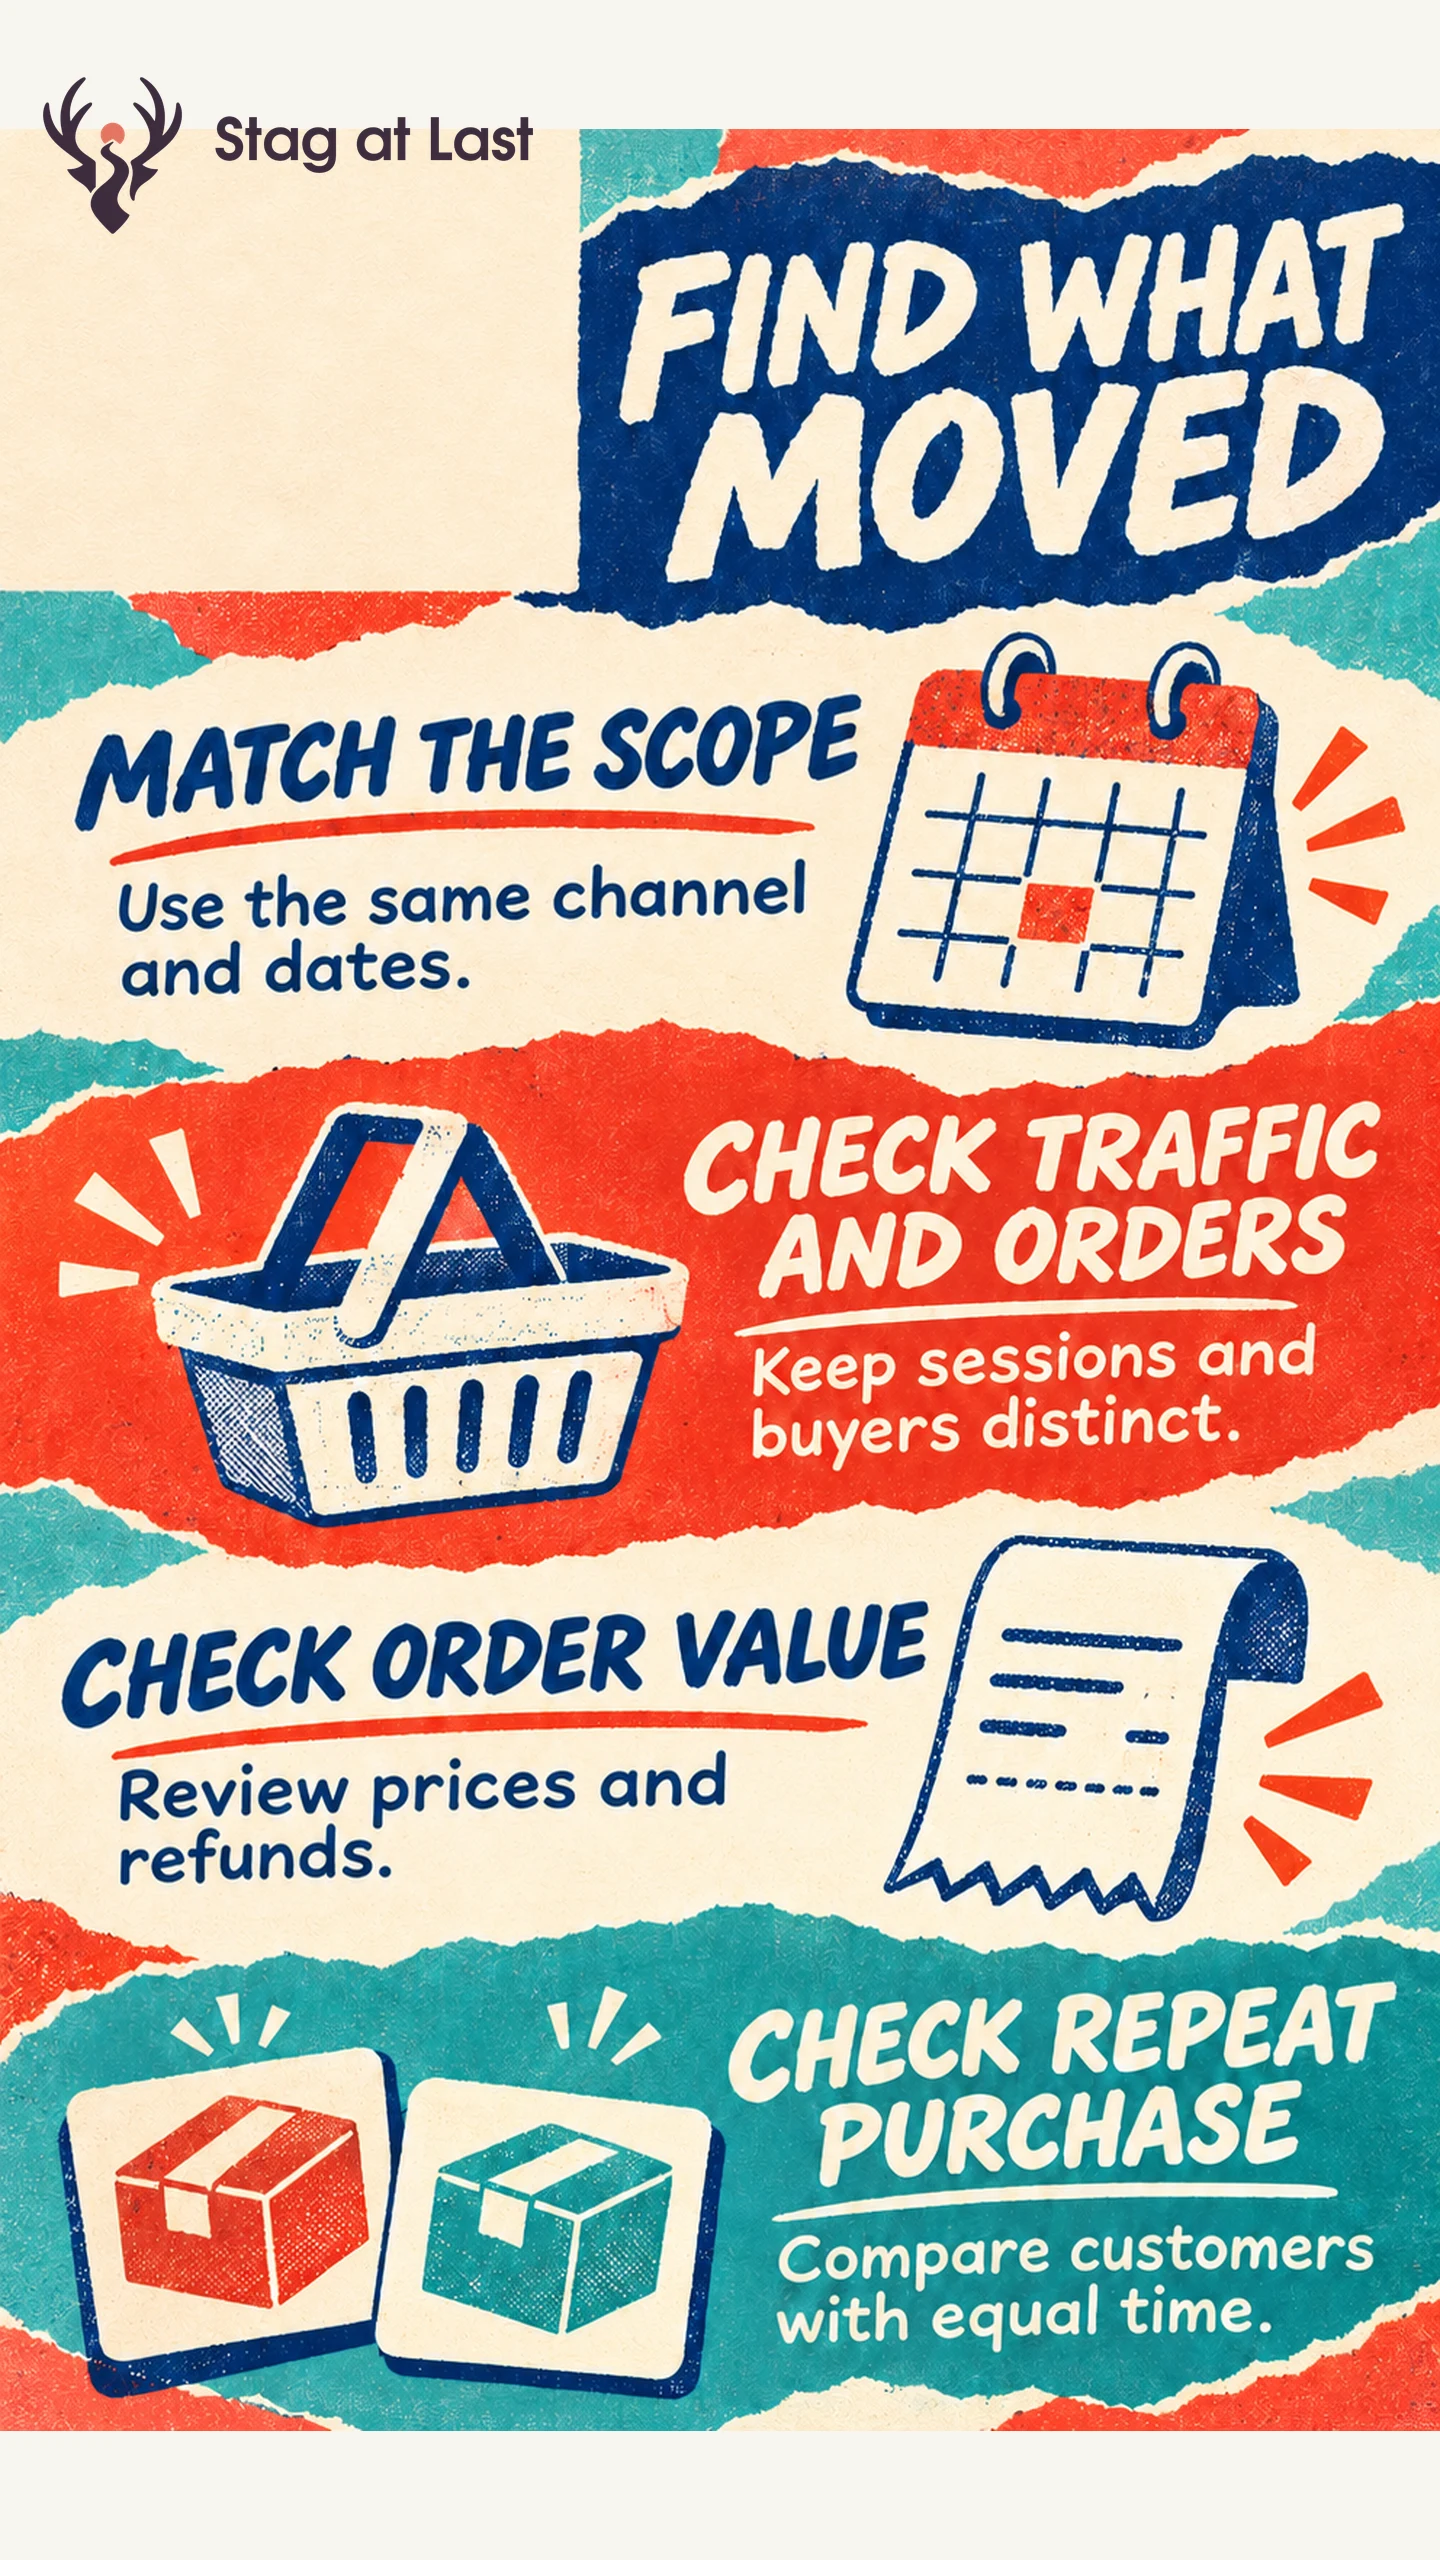
Check whether comparable traffic, orders per session, or order value changed. Then examine first-time and repeat buyers separately to see whose behavior moved.
- Reconcile channels, date ranges and order definitions.
- Calculate orders per session and net merchandise revenue per order for the same scope.
- Check where the change concentrates by channel, device or product.
- Compare repeat purchase among first-order cohorts with equal time to return.
Use the arithmetic to locate the change. Investigate the cause with evidence from the affected segment.
An online store can get more visits and lose sales in the same month. To explain the change, first confirm that the traffic and order data describe the same store and time period. Then separate how many visits arrived, how many orders those visits produced and what each order was worth.
Reconcile the Numbers Before Diagnosing
Use comparable dates, time zones, channel scope, currency and order eligibility. Keep marketplace orders out of an owned-store session calculation. Decide how to treat canceled orders, refunds, taxes and shipping. If refund timing is material, assign adjustments back to the original order for this analysis or state that you are comparing a different accounting view.
For the revenue bridge, define orders per session as eligible orders divided by matching sessions. A dashboard’s conversion metric may count something else. Shopify’s rollout analytics defines online-store conversion as the share of sessions that lead to an order. [1] Multiple orders in one session can make the two rates differ. Keep the dashboard rate for its own purpose and use the order-based ratio in this calculation.
Break Revenue Into Three Comparable Inputs
Multiply sessions by orders per session and net merchandise revenue per order. When the orders and revenue match in scope, the middle terms cancel and the calculation returns net merchandise revenue. Here is a hypothetical store comparison.
| Measure | Prior period | Current period |
|---|---|---|
| Sessions | 10,000 | 12,000 |
| Orders per session | 3.0% | 2.0% |
| Eligible orders | 300 | 240 |
| Net merchandise revenue per order | $60 | $65 |
| Net merchandise revenue | $18,000 | $15,600 |
Change one input at a time, in a stated order. At the prior order rate and order value, 12,000 sessions would produce $21,600, a $3,600 increase. Applying the current order rate lowers that to $14,400, a $7,200 decrease. Applying the current order value raises it to $15,600, adding $1,200. The net change is a $2,400 decline. Changing the order of the steps can change the allocations while leaving the total difference intact.
Inspect the Segment That Moved
In the example, inspect why orders per session fell before choosing a response. Compare source and device mix, the landing pages people reached and which variants were available. A larger share of low-intent traffic can pull down the total even when performance within individual sources is stable. Check the denominator and absolute order count in each group.
If a source’s rate fell within the same landing segment, test checkout, availability and delivery messaging on the affected devices. Use variant availability and placement to investigate an inventory explanation. When order value changes, split price, units, mix and adjustments. Take the result back to your ecommerce test plan and choose one intervention.
Measure Repeat Purchase With Mature Cohorts
Group buyers by their first qualifying order period. Shopify’s customer cohort report uses first-order date to group customers. [2] For a 60-day repeat rate, count customers with a second qualifying order within 60 days of their first and divide by first-time customers with a full 60 days to return. Compare similar acquisition channels and first products when you can.
A rising share of repeat orders can occur because first orders dropped. Use the cohort rate and order counts to distinguish those changes. Consider a loyalty benefit or a replenishment subscription only when the cohort evidence and product use support the idea.
Check the Localized Journey Where Conversion Fell
If the decline is concentrated in one language on a multilingual WordPress store, compare that product page, delivery message and checkout with the original. Include such checks when evaluating a translation workflow.
FAQs About Ecommerce Growth Diagnosis
Why can sales rise while conversion falls?
More sessions or a higher order value can offset a lower purchase rate. Check which traffic or product segments contributed to each change.
Is a higher average order value always good?
A higher order value can come with expensive discounts, shipping or returns. Compare contribution per order and total contribution alongside revenue.
Can I add repeat purchase rate to the revenue formula?
Keep repeat purchase as a separate diagnostic. Repeat orders already contribute to order counts and revenue in the bridge when they fall within its scope.
Sources
[1] Shopify. Rollout analytics
[2] Shopify. Customers reports