
Quick Answer: Which Product Launch Metrics Should You Track?
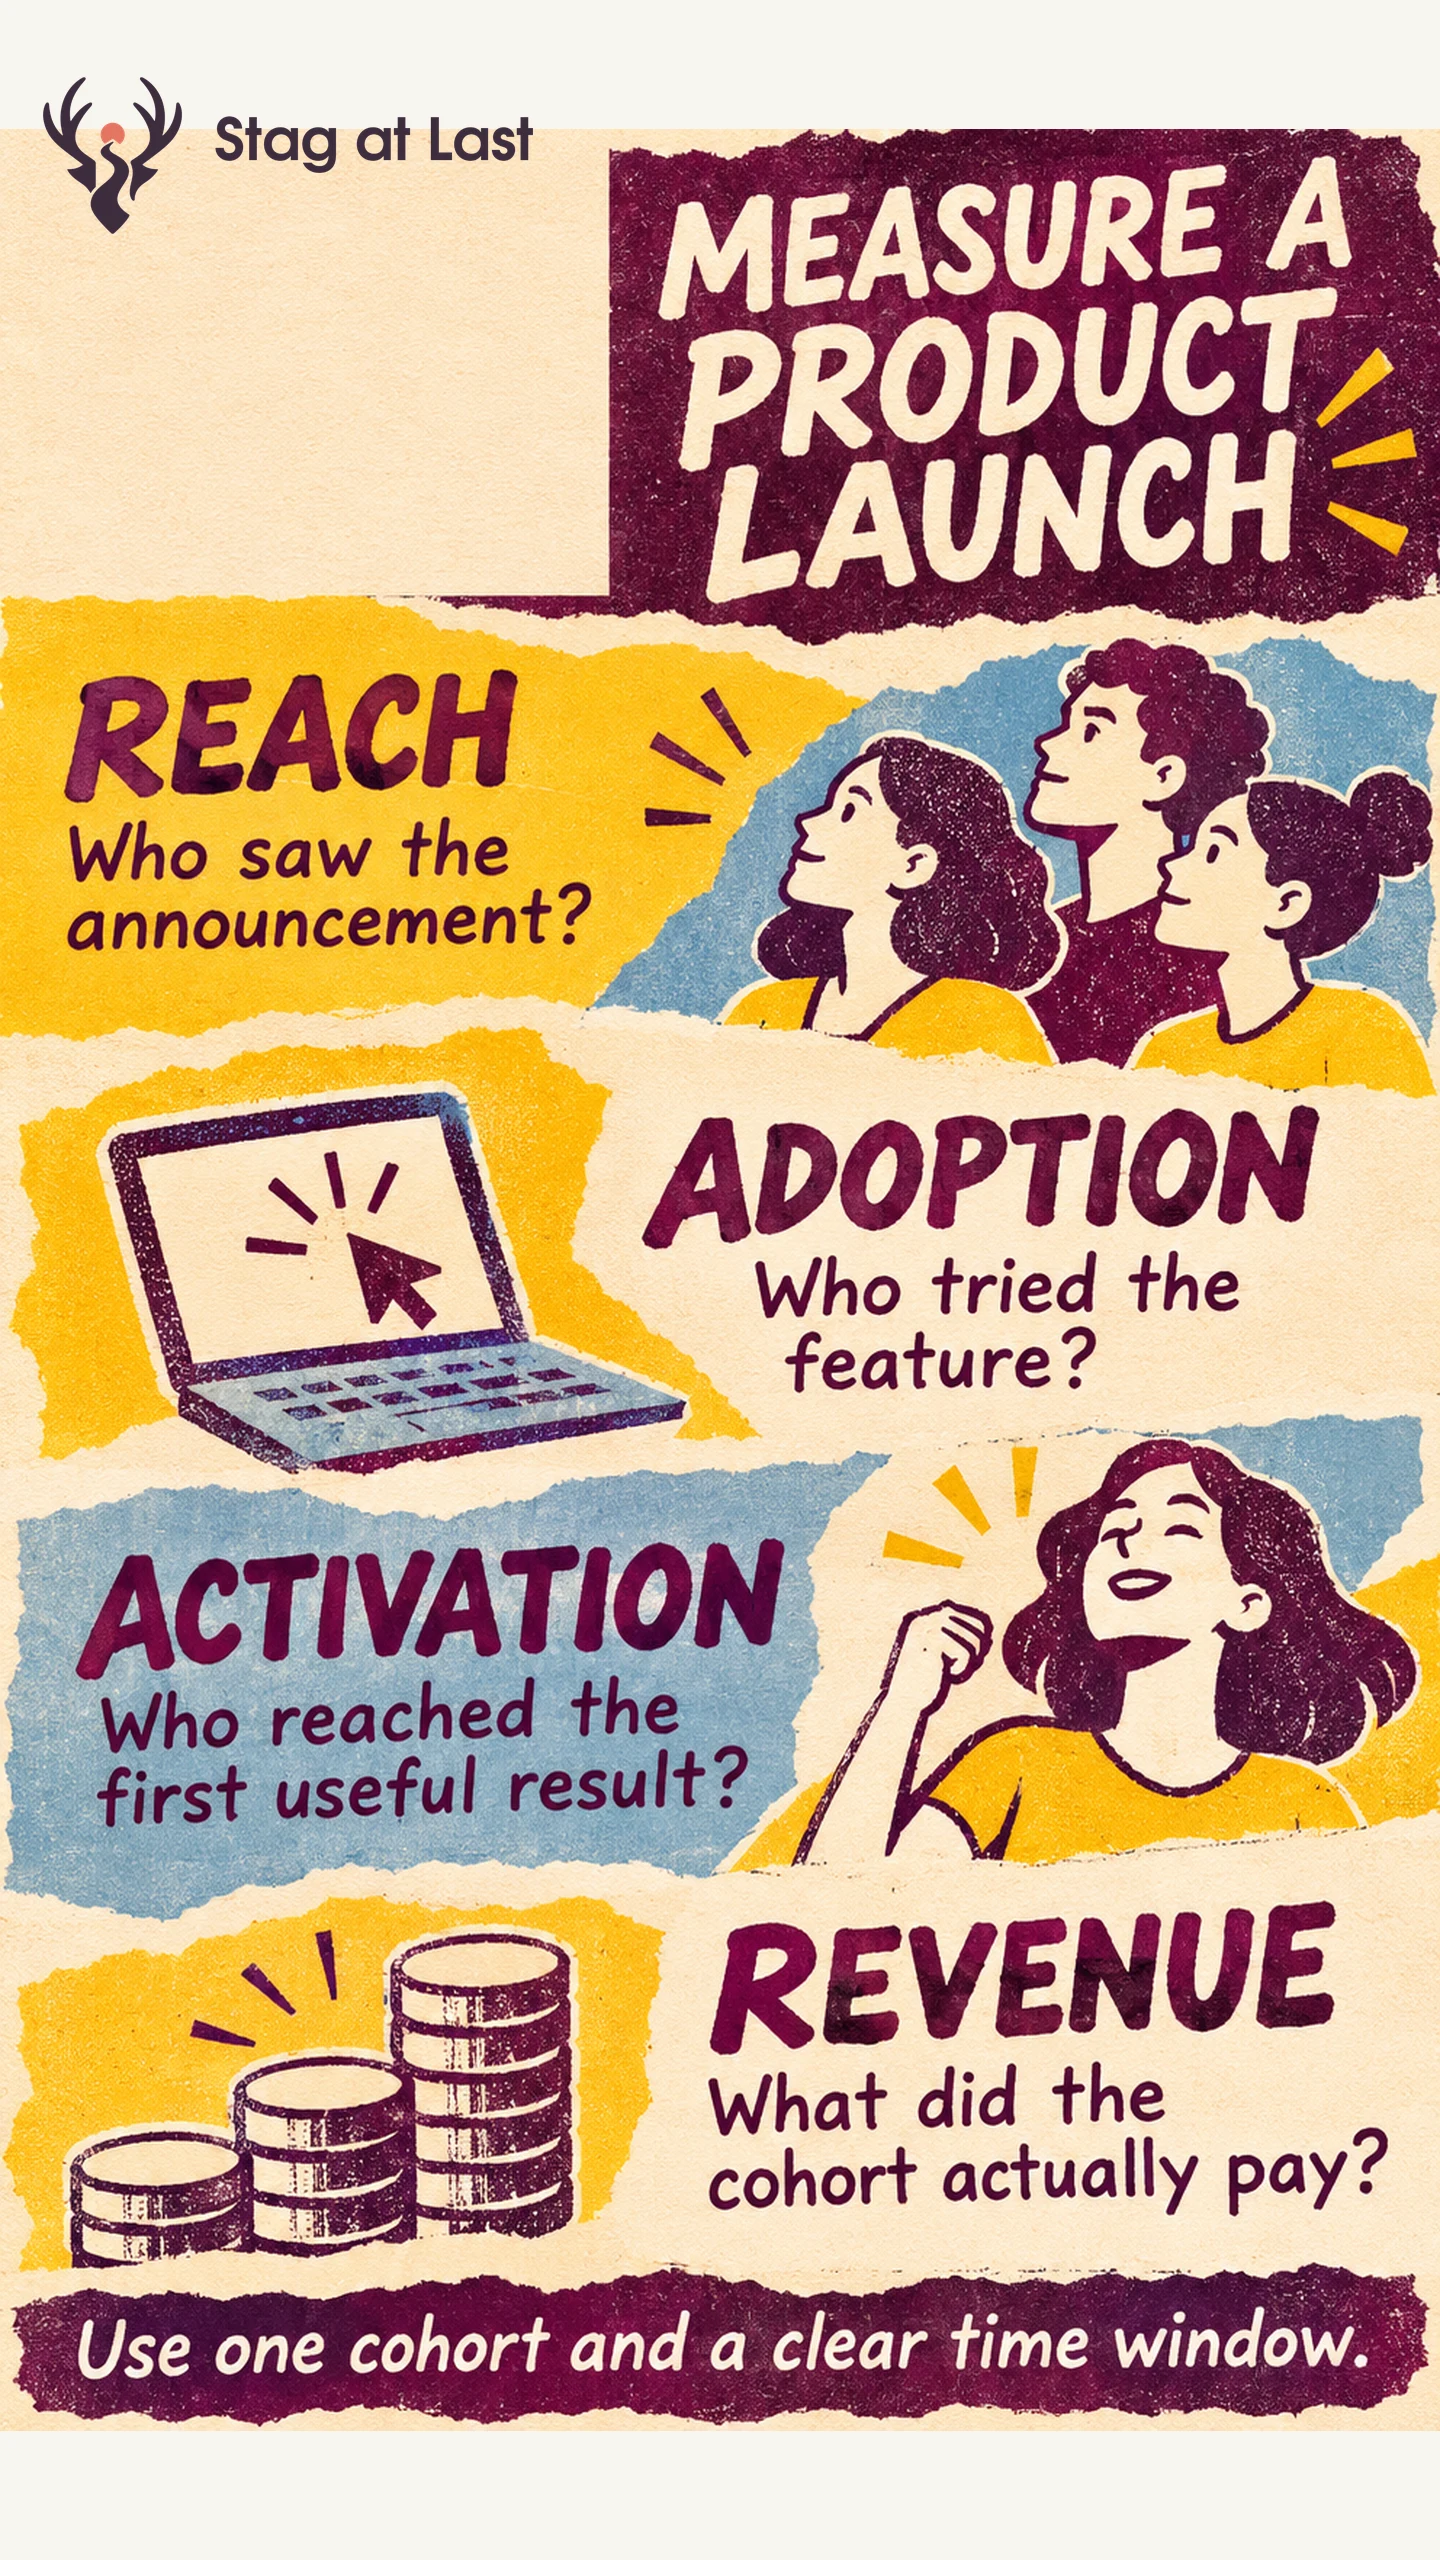
Choose launch metrics based on the decisions your team can make. Track who saw the offer, who tried the release, who achieved the intended result and what the billing records show. Use a named cohort and a defined window for each measure.
- Reach. Count distinct eligible accounts with a recorded exposure where identity is available.
- Adoption. Count accounts that performed the first meaningful feature action.
- Activation. Count accounts that reached a defined result that demonstrates progress.
- Revenue. Reconcile the chosen financial measure against billing records and keep campaign attribution separate.
If a channel only gives you anonymous impressions, report that number separately from account reach.
The announcement can reach plenty of customers while the feature fails at its first real task. A launch scorecard should show where that happens. Start with the release decision, such as fixing onboarding or expanding availability, and choose measures that help you make it.
Start With a Cohort That Can Use the Release
Write down the eligible plan, role, region and version, if those conditions apply. Pick the measurement unit that can take the action. A reporting feature configured once for a workspace is usually easier to evaluate by workspace. A personal workflow inside that workspace may need a user-level view.
Start the observation window when the cohort can use the feature. In a staggered release, compare accounts at the same age since access, and wait for the full window before treating them as mature. Check that the account ID and event definition agree across the source systems you plan to join. Exclude internal tests from the customer cohort.
Give Each Metric a Separate Job
Reach shows opportunity to notice the release. Count unique eligible recipients with a recorded view when you can. If you only know that an email was delivered, call it delivery. Google Analytics 4 defines Total users as unique users who triggered an event in the selected date range. [1] That figure answers a website or app reporting question and needs a valid identity mapping before you use it as a count of eligible product accounts.
Adoption shows a meaningful first action, such as creating a schedule. Activation shows progress after that action, such as the first scheduled report reaching the intended inbox. Define the activation event up front, and decide how long an eligible account needs to complete it. For an outcome that takes a week, a one-day window will miss some successful users.
Revenue needs its own label and source. A paid invoice is different from recurring revenue or recognized revenue. For a launch dashboard, choose a consistent billing measure, such as collected add-on payments net of refunds, and record its currency, period and treatment of tax and credits.
Read One Scorecard From Reach to Revenue
Consider a hypothetical release of a scheduled reporting add-on. The same 100 eligible workspaces gain access on day one and are observed for 14 days. Product events and billing records use the same workspace ID. The team counts each workspace once per stage.
| Measure | Hypothetical observation | What it tells the team |
|---|---|---|
| Reach | 70 workspaces saw the in-app announcement. | The remaining workspaces may have learned about the release elsewhere or missed it. |
| Adoption | 40 of 100 workspaces created a schedule, an adoption rate of 40%. | The team knows how many eligible workspaces began the workflow. |
| Activation | 28 of 40 adopters delivered a scheduled report, a completion rate of 70% among adopters. | Twelve workspaces started without a successful delivery during the window. |
| Collected payments | US$500 in settled add-on payments during the window, net of refunds and excluding tax. | Billing shows what the cohort paid for this add-on during the observation period. |
These reach and usage counts need not form a strict funnel. A workspace can discover the feature directly without seeing the tracked announcement. For an ordered message-to-action funnel, start with eligible workspaces that have a recorded exposure and a complete follow-up window. Count an action only when it follows that exposure within the stated follow-up window.
Decide Which Bottleneck to Fix
For the reporting example, inspect the 12 workspaces with a schedule but no delivered report. Split future-dated schedules, missing permissions and delivery errors before choosing a fix. A workspace whose first run falls outside the window is different from one that attempted delivery and failed. For a deeper investigation, use activation funnel analysis to separate those segments.
If eligible accounts seldom see the offer, review distribution or the announcement’s next step. If users try the feature but stop at setup, test the workflow. Agree on which result would justify expanding the launch, then rerun the same measurement on the next eligible cohort.
Report Attribution and Causal Impact Separately
Record which outcomes followed exposure, within what window and under which attribution rule. The example’s US$500 is a cohort billing total. Estimating incremental revenue requires a credible comparison, such as randomly delaying the message for a comparable eligible group while holding feature access constant. Compare outcomes by assigned group over the same period, ending before the delayed group receives the message. That comparison estimates the effect of sending the message during that period. To estimate the effect of access, design the comparison around access itself.
Check Measurement Across Site Languages
If your launch uses multilingual WordPress pages, evaluate StagLingo on a representative launch page and help page. Verify the offer and next action in each language before comparing the launch journeys.
FAQs About Product Launch Metrics
When should the launch measurement window start?
For adoption and activation, start when the cohort can use the release and give every account the same follow-up window. For channel reporting, document the campaign dates and how you join any later actions.
Should you use users or accounts as the denominator?
Match the unit to the workflow. Use workspaces for shared outcomes and individual users for personal ones, and keep their counts in separate rows.
Can a small launch use a scorecard without a holdout?
Yes. A scorecard can identify recorded friction and inform the next launch wave. Describe the results as observed behavior unless you have a design that supports a causal estimate.
Sources
[1] Google Analytics Help. Understand User Metrics