
Quick Answer: How can you measure the relationship between website speed and conversion?
Measure speed where visitors perform the task, then compare completion among similar visitors. Test a specific performance change under controlled assignment when you need evidence of cause.
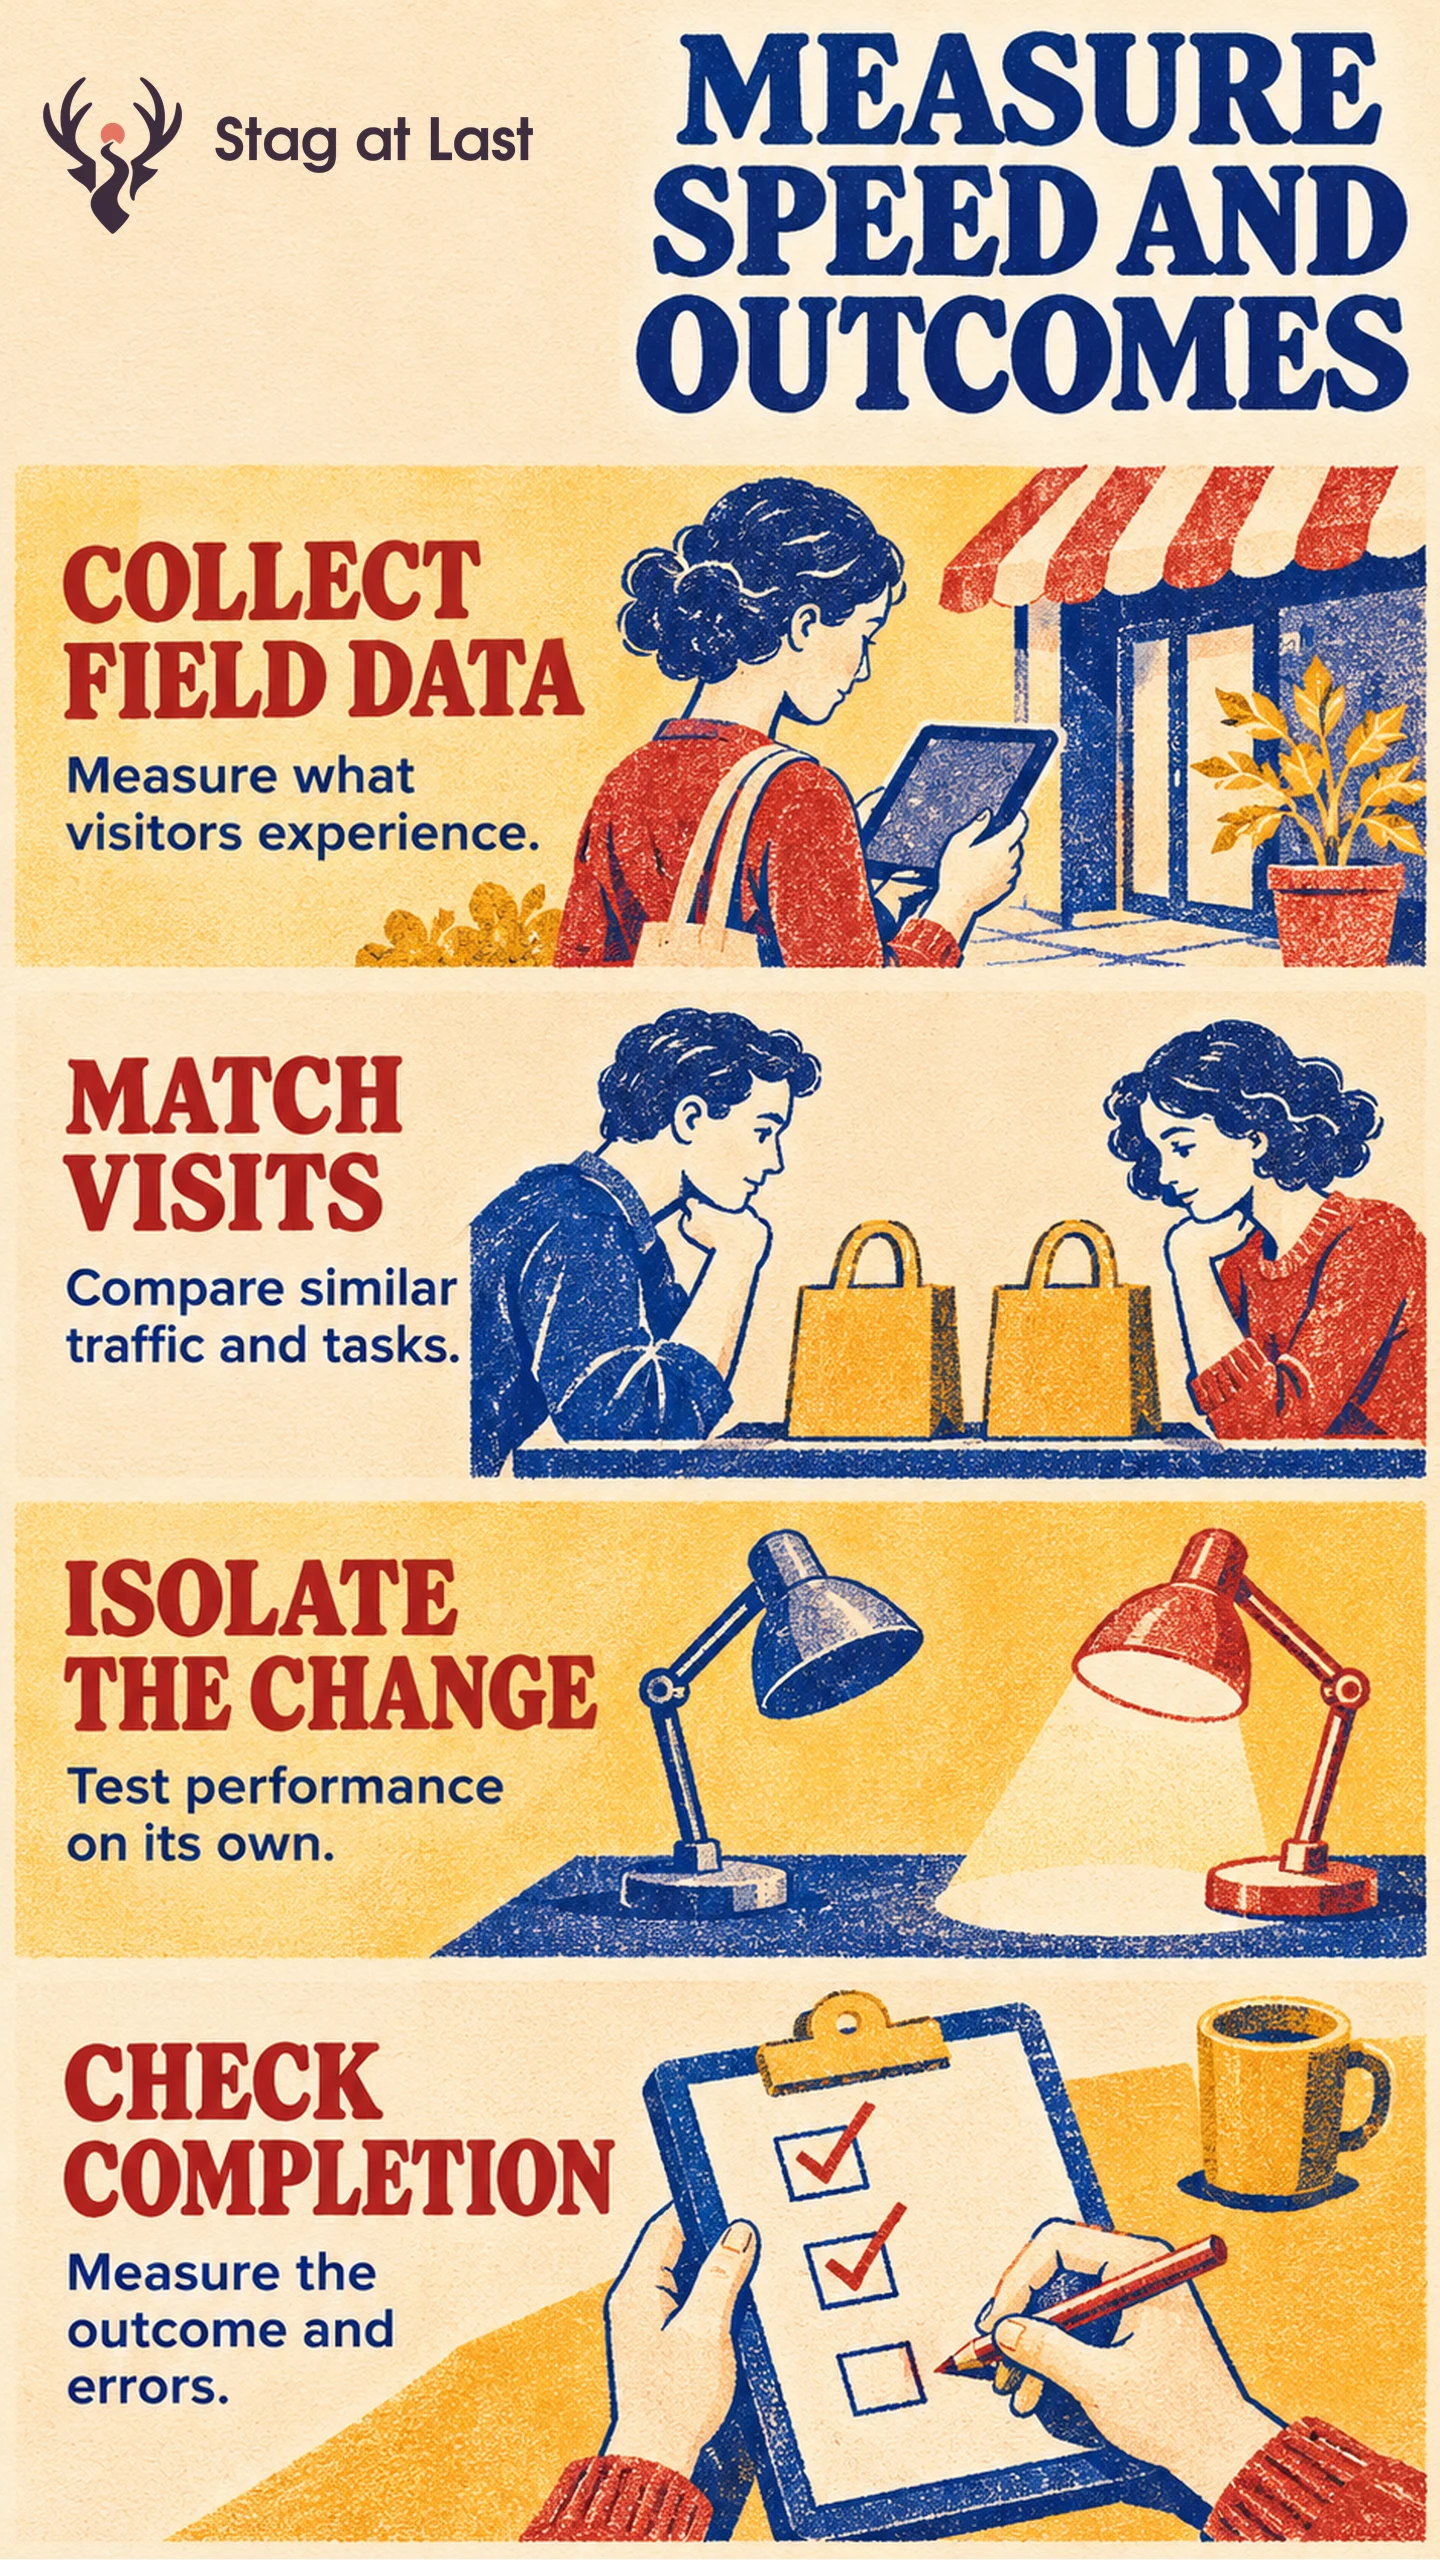
- Collect real-user timings for the relevant page and device.
- Define a consistent outcome and check timing coverage.
- Change one performance mechanism and compare assigned groups.
A faster metric and a higher conversion rate can move together for reasons unrelated to the speed change.
A product page becomes faster during the same week an email campaign brings existing buyers back to the store. Sales rise. To estimate what speed contributed, measure the page visitors actually saw and establish a comparison that accounts for the changing audience.
Measure the Experience at the Page That Matters
Choose a page or step that can plausibly block completion. Largest Contentful Paint measures how long the biggest visible content element used for the metric takes to render. Interaction to Next Paint measures interaction responsiveness. Cumulative Layout Shift measures unexpected visual movement. Google’s Core Web Vitals guidance evaluates the 75th percentile of page loads for its thresholds, with mobile and desktop considered separately. [1] Track metrics that match the suspected failure rather than treating all three as interchangeable.
Use field measurements to see the distribution real visitors experience. Reproduce slow behavior in a lab with a controlled device and network to inspect what caused a delay. The two views can differ because actual visitors use diverse hardware, connections and paths. [2] If a public field report only shows an origin-level result, it cannot establish that your checkout page had that experience.
Compare Visits That Had a Similar Task
Write the outcome and denominator before joining speed and business data. For example, use confirmed orders within a specified time among eligible visitors entering the product detail page, not orders among people whose performance measurement arrived. If shoppers close before the client beacon fires, the missingness may matter. Track the share of eligible visits with timings.
Compare similar entry pages, devices, sources and dates. Use the mobile conversion diagnostic when device or browser mix changed. Report timing coverage and completed orders for each comparison. A group with faster recorded visits may contain more returning shoppers or better connections. A comparison of speed buckets is descriptive.
Isolate the Performance Change When You Can
In an illustrative test, randomize eligible visitors to the same product page with either its current image delivery or a faster version of that pipeline. Keep price, offer, layout and visible asset comparable. Confirm the intended timing improves, then compare everyone as assigned using the preplanned outcome window. The experiment estimates the effect of the image-delivery change on conversion. Timing helps explain the mechanism without establishing a conversion gain per millisecond saved. Check errors, quality and incomplete timings alongside the randomized comparison.
When a release changes layout, text and speed together, use a redesign measurement plan to record the bundle and competing changes. If only a before-and-after comparison is feasible, report which factors you could account for and keep the causal interpretation limited.
Report Speed, Completion and Problems Together
Include the page, segment, dates, timing coverage, field percentile, conversion effect and relevant error rates. Review timing changes on the targeted step before interpreting a downstream outcome. Report coverage for each metric. For INP, distinguish page visits with no qualifying interaction from missing records where one occurred. Verify that critical interactions and the route to confirmation still work.
Measure Performance on Localized Pages Too
If you publish multilingual pages in WordPress, evaluate StagLingo on a few sample pages. Include the new language versions in the same speed and end-to-end task checks before release.
FAQs About Website Speed and Conversion FAQs
Will a better Core Web Vitals result always raise conversion?
No. The business effect depends on the people, task and actual impediment. Measure completion along with the performance change.
Can a single Lighthouse run answer the question?
No. A lab run can locate a delay under controlled conditions. Add field timing and outcome data to assess the actual path.
Which pages should you measure first?
Start with heavily used entry pages or high-friction steps near a purchase or lead, especially where real users report delays.
Sources
[1] web.dev. Web Vitals
[2] web.dev. Why Lab and Field Data Can Be Different