
Quick Answer: How does statistical significance differ from business significance?
Statistical significance describes evidence against a specified hypothesis under a test’s assumptions. Business significance asks whether the effect is large enough to justify the cost, risk and effort of making the change.
| Question | Statistical significance | Business significance |
|---|---|---|
| What matters? | Evidence against the specified null | Value against a practical threshold |
| What to inspect? | Effect estimate, interval and analysis validity | Margin, costs, guardrails and eligible volume |
| What changes the decision? | Where the uncertainty allows meaningful effects | Whether plausible gains justify rollout |
Compare the effect and its uncertainty with the business threshold before deciding.
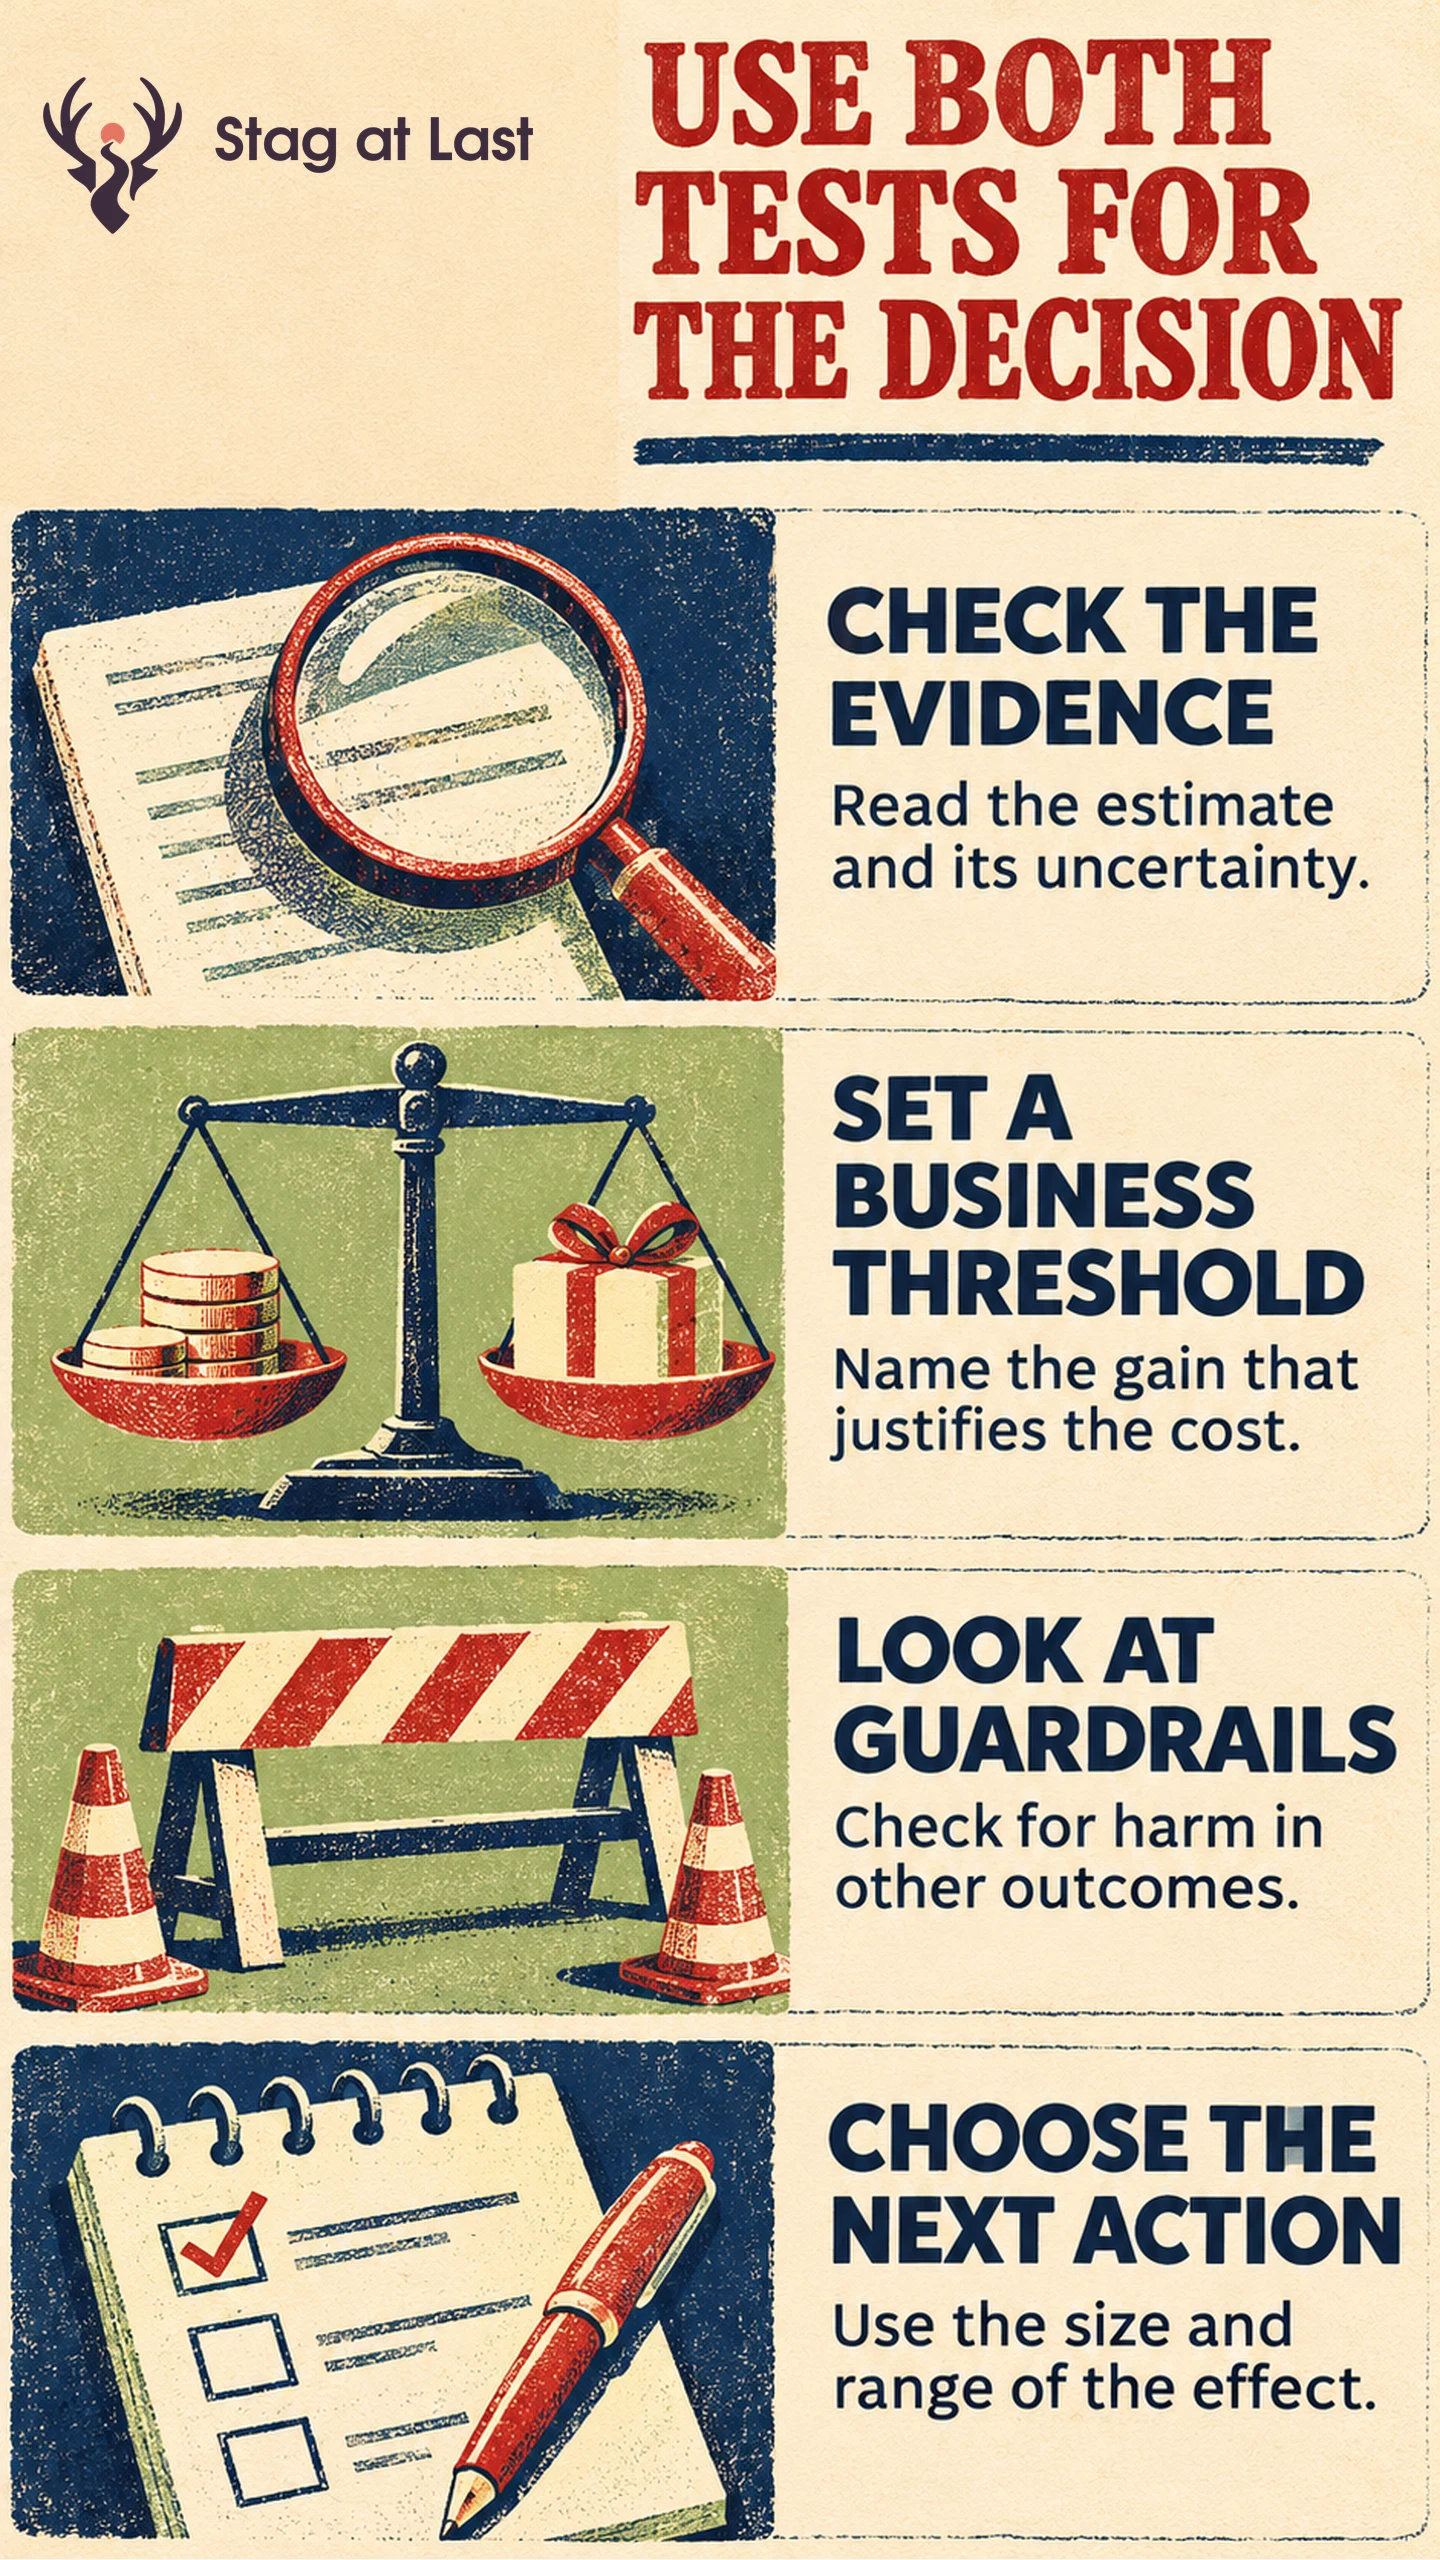
A large experiment can find a reliable difference that creates little business value. A small experiment can show a promising estimate with too much uncertainty to act. Establish both what the test can tell you and what the decision requires.
Set the Business Threshold Before the Test
Translate the change into a metric that the team can act on. If the project is justified by sales, define an order outcome per eligible assigned visitor and a follow-up window. Estimate the implementation effort, recurring costs and contribution from an additional order. Work back to an effect that would justify the investment.
Name guardrails for outcomes that could get worse, such as returns, support workload or accessibility. Put the threshold and tolerable downsides in the test plan. Use the sample-size calculation that fits the hypothesis the team actually needs to evaluate.
Read the Estimate and Its Uncertainty
The American Statistical Association states that a p-value or statistical significance does not establish effect size or importance. [1] Review assignment and measurement first, then report the difference, its units and an interval calculated using the planned method.
In a hypothetical fixed-horizon test with 500,000 eligible visitors per group, 15,000 purchase in the control and 15,500 in the new version within seven days of assignment. The rates are 3.00% and 3.10%. The increase is 0.10 percentage points, about 3.3% relative. An approximate 95% interval for the difference is 0.03 to 0.17 percentage points, using independent visitor groups and a normal approximation.
If the business requires at least 0.30 percentage points, the illustrative interval is above zero but entirely below that threshold. A wider interval spanning the threshold leaves a different question open. Use the inconclusive-results guide when both inadequate and worthwhile gains remain plausible.
Translate the Effect Into a Decision
At the point estimate, applying the hypothetical effect to 500,000 comparable visitors over the next quarter would mean 500 additional orders, assuming one order per additional purchasing visitor. At $25 contribution per additional order, that is $12,500 before implementation and recurring costs. The 0.30-point threshold would represent 1,500 additional orders or $37,500 in contribution over that quarter under the same assumptions. Treat both figures as projections under the stated traffic and margin assumptions. Check net costs, sustained demand and guardrails before using it.
Write a plain-language decision such as “The purchase effect is positive in this analysis, but falls below our minimum worthwhile gain.” A cheap and reversible change may warrant a different threshold from an expensive redesign. Agree that threshold before seeing the result, or label a later economic sensitivity check separately.
Check Localized Offers Before Comparing Results
If you are testing WordPress pages in more than one language, evaluate StagLingo on a few representative versions. Check that local prices and terms support the same business decision before comparing them.
FAQs About Statistical and Business Significance
Can a statistically significant result be too small to ship?
Yes. A precise positive estimate can still fall below the gain needed to cover costs or justify the work.
Does a nonsignificant result prove there is no effect?
No. The range of effects may still include a meaningful benefit or harm. Use the interval and a preplanned practical threshold to decide what the data resolve.
How should you treat a guardrail with an uncertain effect?
Check the magnitude and uncertainty against the predefined acceptable downside. If material harm is still plausible, follow the planned rule for additional evidence, monitoring or holding the rollout.
Sources
[1] American Statistical Association. Statement on Statistical Significance and P-Values